¶ Functions
- 线性X-线性Y:
Plot[f,{x,xmin,xmax}], ListPlot[f,{x,xmin,xmax}] - 对数X-线性Y:
LogLinearPlot[f,{x,xmin,xmax}], ListLogLinearPlot[f,{x,xmin,xmax}] - 对数X-对数Y:
LogPlot[f,{x,xmin,xmax}], ListLogPlot[f,{x,xmin,xmax}]
¶ Options
¶ Axes (坐标轴)
是图形函数的一个选项,用以指定是否应该画出坐标轴.
Plot[f,{x,xmin,xmax}, PlotLegneds -> {True,None}]
True: 画出所有坐标轴None: 不画坐标轴{True,None}: 不画出 x 轴, 画出 y 轴
¶ AxesLabel (坐标轴标签)
Plot[Sinc[x], {x, 0, 10}, AxesLabel -> Sinc[x]]: y轴标签Plot[Sinc[x], {x, 0, 10}, AxesLabel -> {x,Sinc[x]}]: x轴标签 + y轴标签
¶ Ticks (刻度数值)
Plot[Sin[x], {x, 0, 10}, Ticks -> { {0, Pi, 2 Pi, 3 Pi}, {-1, 1} }]
Automatic:自动放置刻度None: 不绘制刻度{xticks,yticks}: 对每个坐标轴分别指定刻度
¶ PlotLegends (绘图的图例)
Plot[f,{x,xmin,xmax}, PlotLegneds -> Automatic]
Automatic: 用可编辑的占位符作为图例"Expressions": 用所绘曲线的表达式作为图例{"sin(x)", "cos(x)"}: 指定作为图例的文字Placed[{"sin(x)", "cos(x)"}, Above]: 把图例置于绘图的上面
¶ PlotLabels (数据绘制标签)

Plot[f,{x,xmin,xmax}, PlotLabels -> "Expressions"]
Automatic:"Expressions": 用所绘曲线的表达式作为标签{"sin(x)", "cos(x)"}: 指定数据使用的标签Placed[{Automatic, Above]: 把数据置于绘图的上面
¶ PlotLabel (绘图标签)
Plot[BesselJ[1, x], {x, 0, 10}, PlotLabel -> BesselJ[1, x]]: 对标签用任何 Wolfram 语言的符号Plot[BesselJ[1, x], {x, 0, 10}, PlotLabel -> BesselJ[1, x]]: 对标签用任何 Wolfram 语言的符号
¶ PlotRange (绘制范围)

¶ GridLines (网格线)
Plot[f,{x,xmin,xmax}, GridLines -> {xGrid,yGrid}]
利用 Tabel 数组,嵌套的数组利用 Flatten 打平
xGrid = Flatten[Table[j*Table[10^i, {i, 1, 6}], {j, 1, 9}]];
yGrid = Table[i, {i, -20, 70, 6}];
¶ Frame (边框)
Plot[f,{x,xmin,xmax}, Frame -> True]
True: 在整个对象周围绘制边框线False或None: 不绘制边框线All: 在 Grid 的每一个项周围绘制边框线等
¶ FrameTicks (边框刻度数值)
Plot[f,{x,xmin,xmax}, FrameTicks -> True]
True: 自动在底部和左边放置刻度None: 不绘制刻度All: 自动在每边放置刻度{ {left,right},{bottom,top} }: 分别指定每边的刻度选项,这的虚线可以数组{0,1,2},也可以是True/None
¶ Filling (填补)
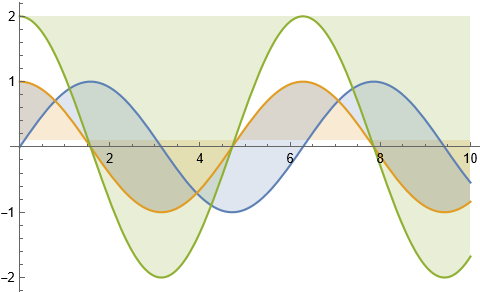
Plot[{Sin[x],Cos[x],2*Cos[x]}, {x, 0, 10}, Filling-> Axis]
None: 没有填充 ( 缺省)Axis: 填充至轴Bottom: 填充至图形底部Top: 填充至图形顶部v: 填充至值 v{m}: 填充至第 m个对象,即前面的第几个函数{i1->p1, i2-> p2, ...}: 从对象 ik 到 pk 填充, 例如
对于7,Sin[x] 填充到第2个对象即 Cos[x];Cos[x] 填充到数值 0.1;2*Cos[x] 填充到顶部 Top;
Plot[{Sin[x],Cos[x],2*Cos[x]}, {x, 0, 10}, Filling-> {1->{2},2->0.1,3->Top}]
¶ ImageSize (图像尺寸)
Plot[{Sin[x],Cos[x],2*Cos[x]}, {x, 0, 10}, ImageSize-> Medium]
Automatic: 通过位置或其它维数确定(默认)Tiny, Small, Medium, Large: 预定义绝对大小{w,h}: 显式的宽度和高度
¶ AspectRatio (宽高比)
Plot[{Sin[x],Cos[x],2*Cos[x]}, {x, 0, 10}, AspectRatio-> Medium]
Automatic: 根据实际坐标值确定比值Full: 拉伸图形填充封闭区域a: 明确的高宽比,比如1或者0.5
¶ PlotStyle (绘图样式)
Plot[{Sin[x], {x, 0, 10}, PlotStyle-> Red]
搜索帮助文档 GraphicsDirectives 更多的 PlotStyle 的结果,同时可以使用 Directive[g1,g2...] 的方式指定多个图形指令。常用的有如下
Blue,Red,Orange...: 颜色Thick, Thin: 线宽Dashed, Dotted, DotDashed, Dashing: 虚线
¶ PlotPoints/MaxRecursion(绘制精度)
Plot[{Sin[x], {x, 0, 10}, PlotPoints -> 50] 或者 Plot[{Sin[x], {x, 0, 10}, MaxRecursion -> 10]
控制绘制的精度,MaxRecursion 更好用一些,默认值为2
¶ 排列显示
¶ GraphicsRow
GraphicsRow[{p1, p2}, Spacings -> 30]
¶ GraphicsGrid
GraphicsGrid[{ {p1, p2, p3},{p4, p5, p6} }] 2排显示,每排3个;